
Highest protein per 100 calories
Foods ranked by protein density — grams of protein per 100 kcal.
2036 ranked foods
| # | Food | Category | g / 100 kcal |
|---|---|---|---|
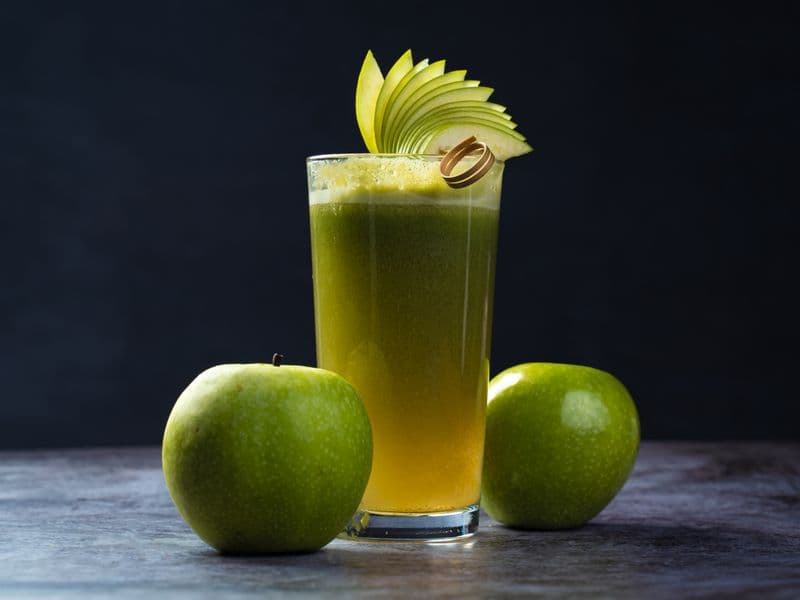
| 1926 | Apple juice | Fruits | 0.2 |
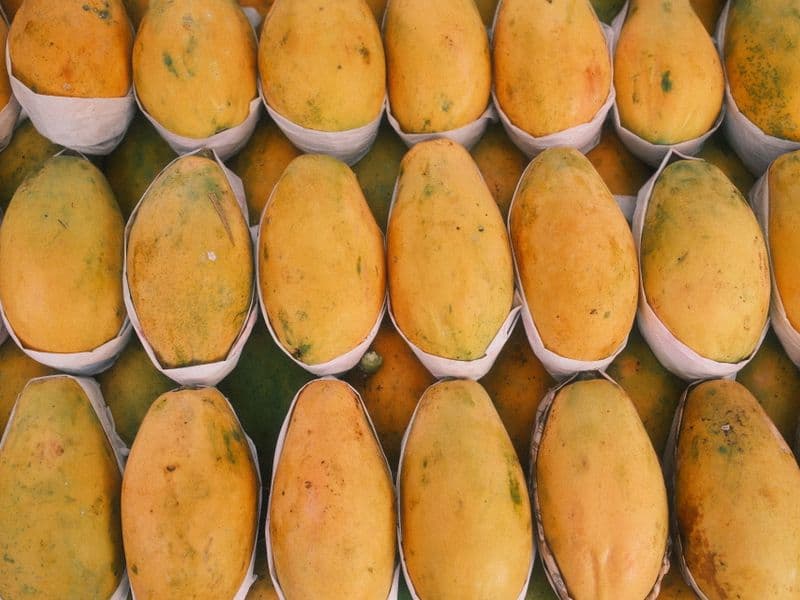
| 1927 | Mango nectar | Fruits | 0.2 |
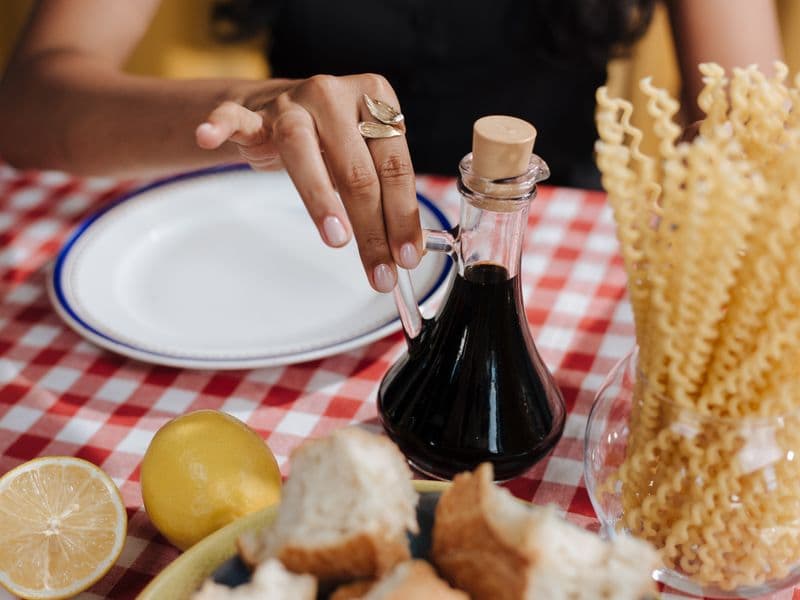
| 1928 | Red wine vinegar | Herbs & Spices | 0.2 |
| 1929 | French dressing | Prepared Foods | 0.2 |
| 1930 | Pear nectar | Fruits | 0.2 |
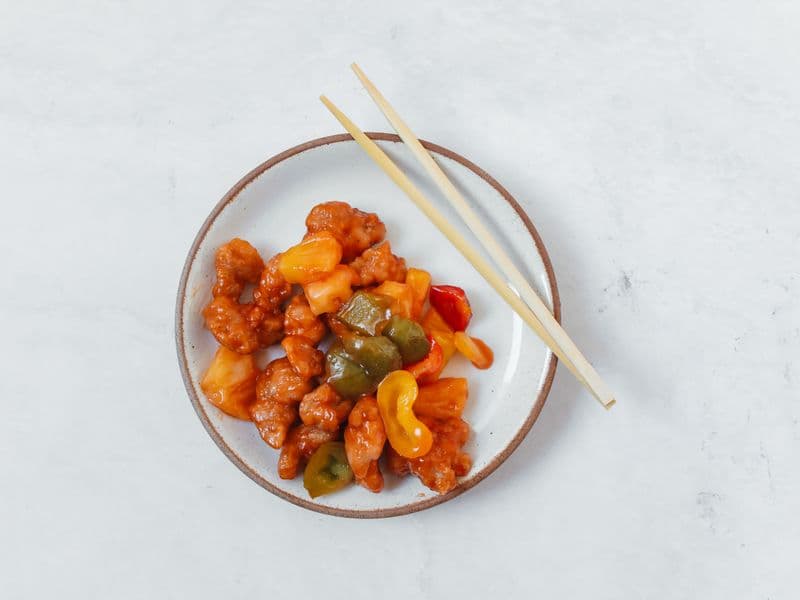
| 1931 | Sweet and sour sauce | Prepared Foods | 0.2 |
| 1932 | Italian dressing | Prepared Foods | 0.2 |
| 1933 | Mayonnaise | Fats & Oils | 0.2 |
| 1934 | Wine cooler / spritzer | Beverages | 0.1 |
| 1935 | Maraschino cherries | Fruits | 0.1 |
| 1936 | Jam / preserves | Prepared Foods | 0.1 |
| 1937 | Margarine, regular | Fats & Oils | 0.1 |
| 1938 | Fruit punch drink | Beverages | 0.1 |
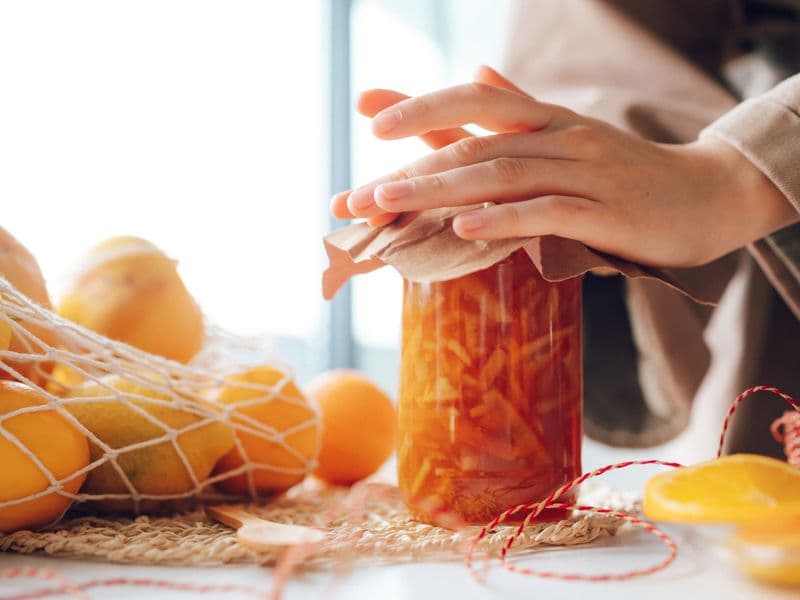
| 1939 | Orange marmalade | Prepared Foods | 0.1 |
| 1940 | Butter, salted | Dairy | 0.1 |
| 1941 | Veggie Straws Sea Salt | Prepared Foods | 0.1 |
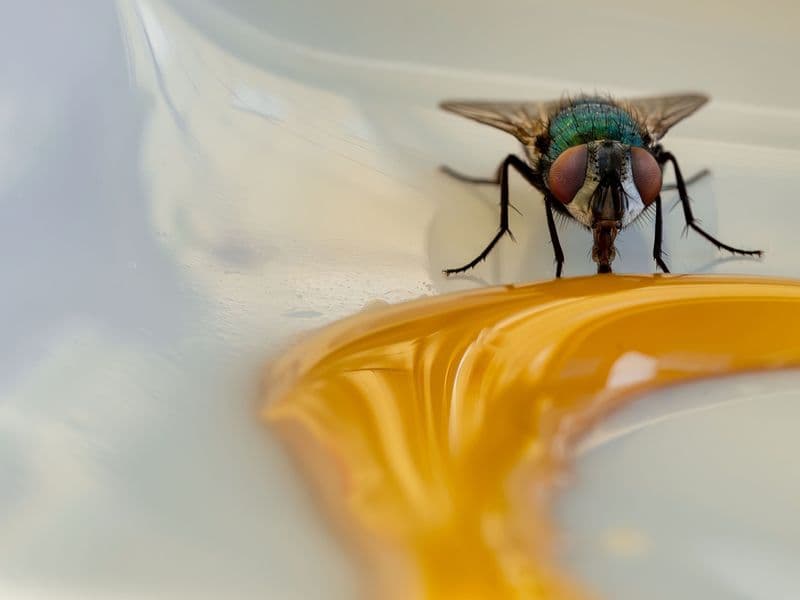
| 1942 | Honey | Sweeteners | 0.1 |
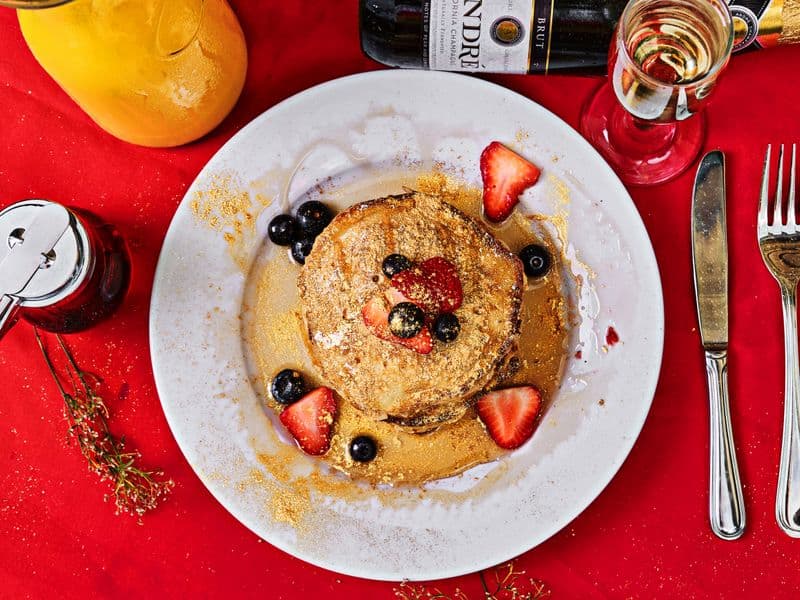
| 1943 | Mimosa | Beverages | 0.1 |
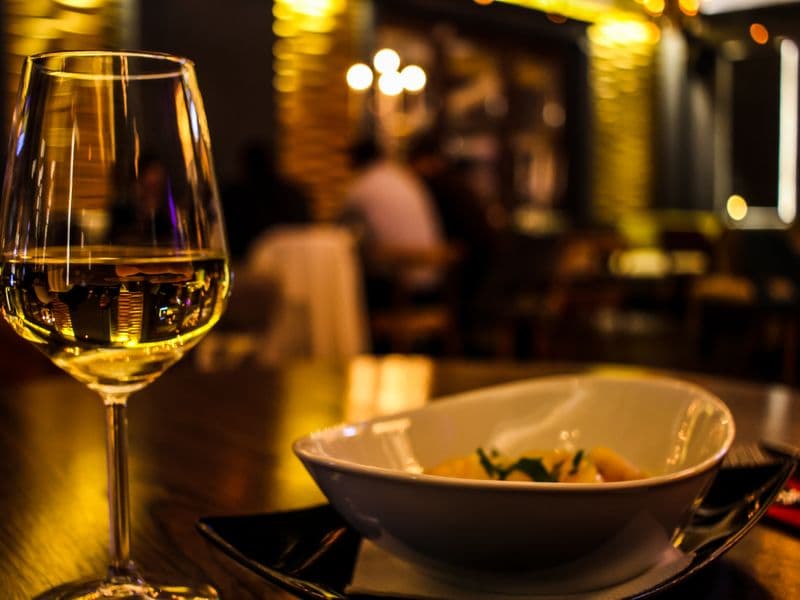
| 1944 | White wine | Beverages | 0.1 |
| 1945 | Arrowroot flour | Grains | 0.1 |
| 1946 | Red wine | Beverages | 0.1 |
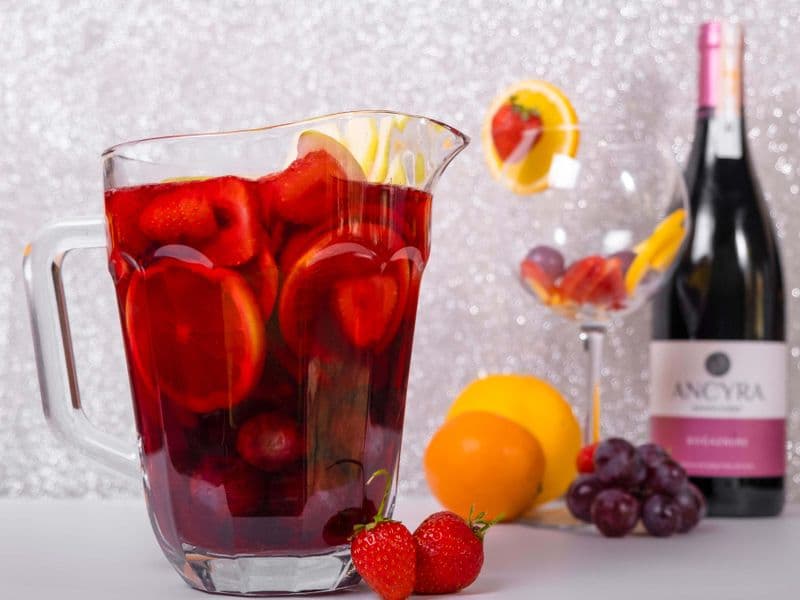
| 1947 | Sangria | Beverages | 0.1 |
| 1948 | Cornstarch | Grains | 0.1 |
| 1949 | Butter, whipped | Fats & Oils | 0.1 |
| 1950 | Olive Oil | Seafood | 0.1 |


How this is calculatedformula · basis · source
Formula: protein_per_100g ÷ energy_kcal_per_100g × 100
Basis: Protein grams per 100 kcal (energy density basis).
Source: USDA FoodData Central. Foods missing this value are not ranked (missing ≠ zero).