
Highest-protein foods
Foods ranked by protein content per 100 g.
2040 ranked foods
| # | Food | Category | g |
|---|---|---|---|
| 1926 | Beer, light | Beverages | 0.2 |
| 1927 | Maraschino cherries | Fruits | 0.2 |
| 1928 | Peach nectar | Fruits | 0.2 |
| 1929 | Fruit punch drink | Beverages | 0.2 |
| 1930 | Tapioca, pearl, dry | Grains | 0.2 |
| 1931 | Apples, canned | Fruits | 0.2 |
| 1932 | Applesauce, unsweetened | Fruits | 0.2 |
| 1933 | Apricot nectar | Fruits | 0.2 |
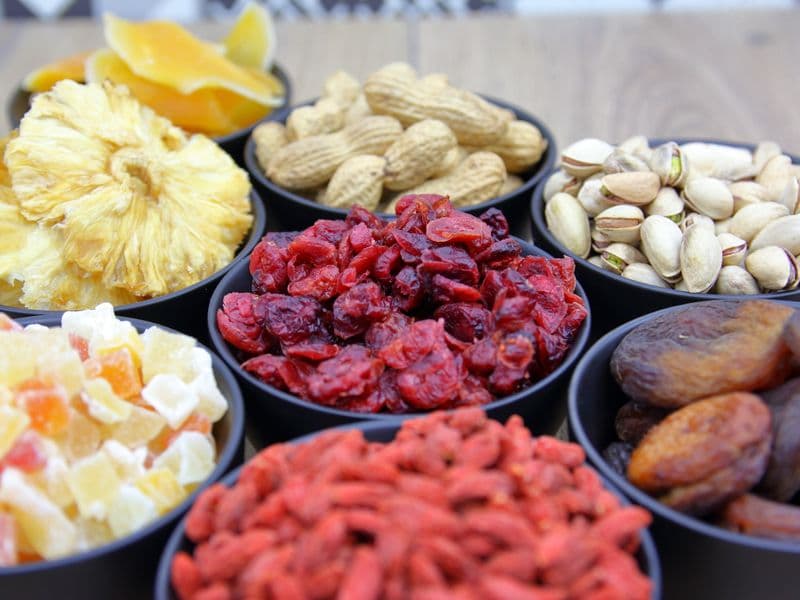
| 1934 | Dried cranberries | Fruits | 0.2 |
| 1935 | Papaya nectar | Fruits | 0.2 |
| 1936 | Applesauce, sweetened | Fruits | 0.2 |
| 1937 | Jelly | Prepared Foods | 0.2 |
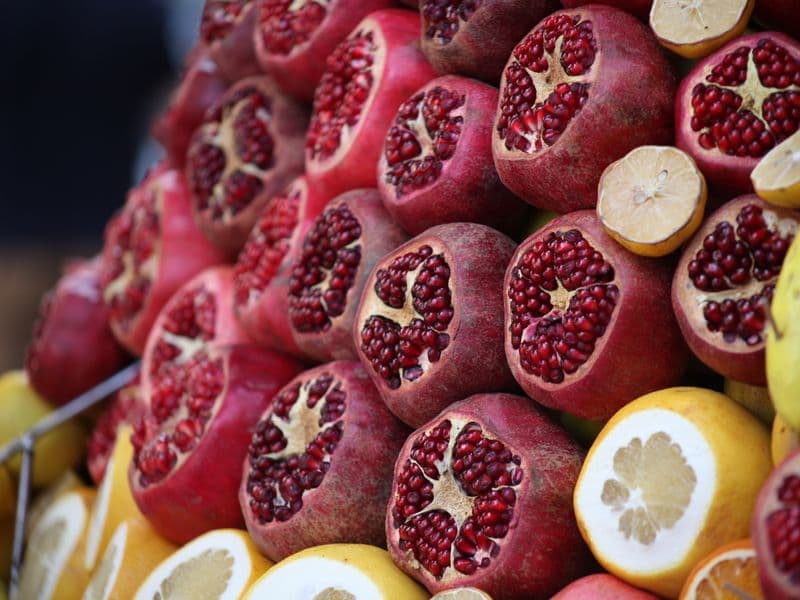
| 1938 | Pomegranate juice | Fruits | 0.2 |
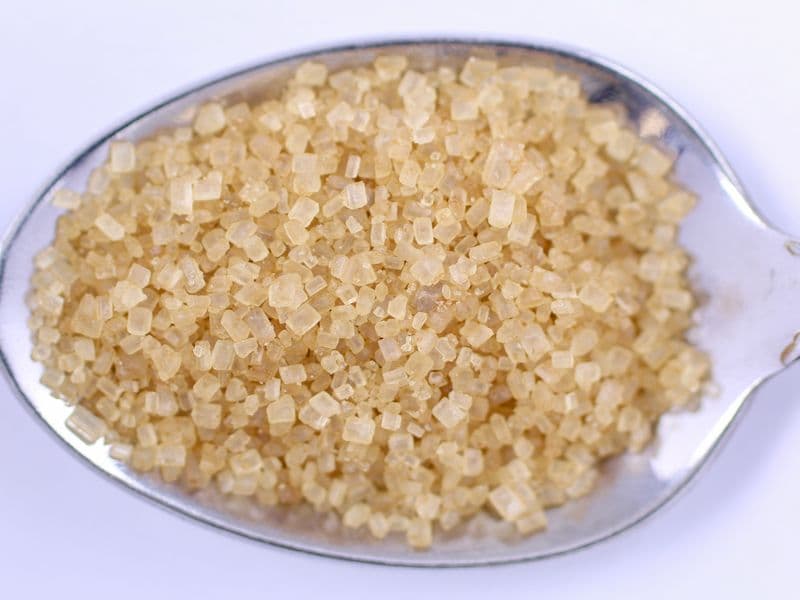
| 1939 | Brown sugar | Sweeteners | 0.1 |
| 1940 | Coffee, brewed | Beverages | 0.1 |
| 1941 | Espresso | Beverages | 0.1 |
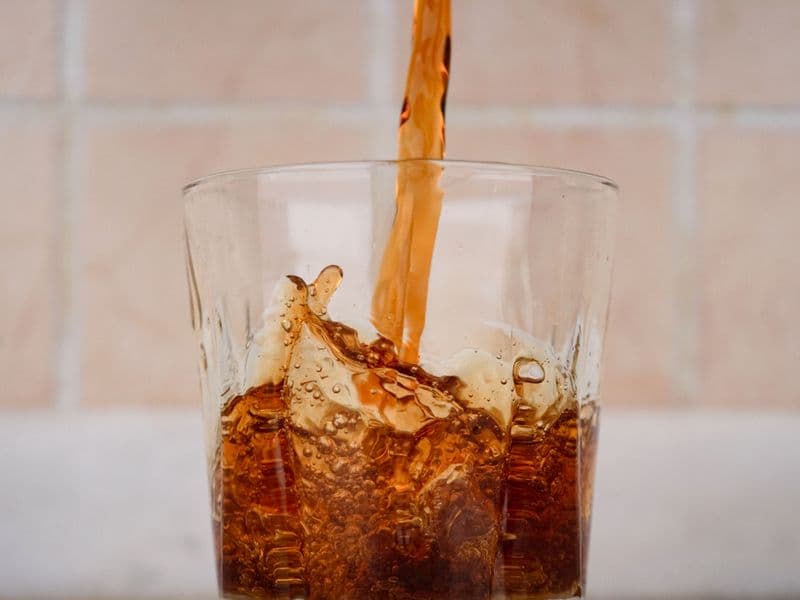
| 1942 | Diet cola | Beverages | 0.1 |
| 1943 | Mango nectar | Fruits | 0.1 |
| 1944 | Pear nectar | Fruits | 0.1 |
| 1945 | Apple & Blackcurrant | Beverages | 0.1 |
| 1946 | Apple juice | Fruits | 0.1 |
| 1947 | Coffee liqueur | Beverages | 0.1 |
| 1948 | Instant coffee, prepared | Beverages | 0.1 |
| 1949 | Maple sugar | Sweeteners | 0.1 |
| 1950 | Sparkling Blood Orange Beverage | Beverages | 0.1 |

How this is calculatedformula · basis · source
Formula: protein grams per 100 g
Basis: Per 100 g edible portion.
Source: USDA FoodData Central. Foods missing this value are not ranked (missing ≠ zero).