
Highest-protein foods
Foods ranked by protein content per 100 g.
2040 ranked foods
| # | Food | Category | g |
|---|---|---|---|
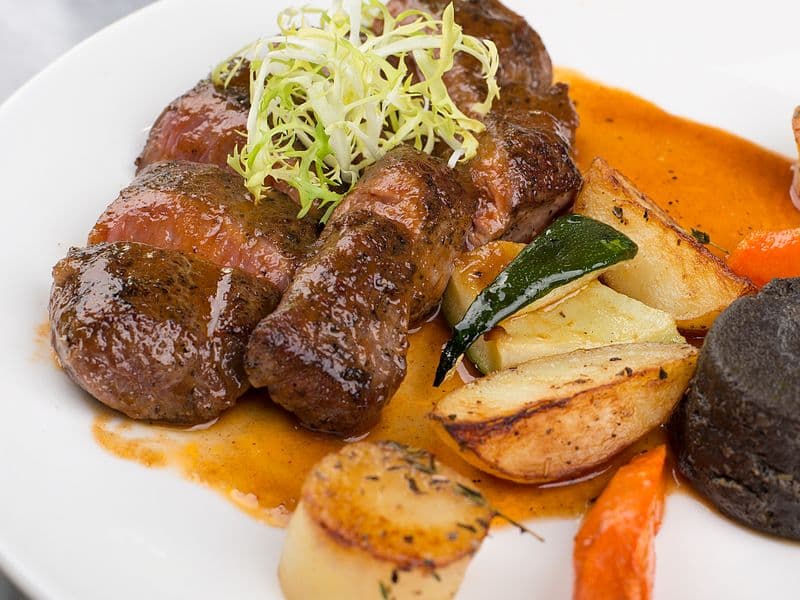
| 26 | Beef bottom round, cooked | Red Meat | 32.7 |
| 27 | Cottonseed kernels, roasted | Nuts & Seeds | 32.6 |
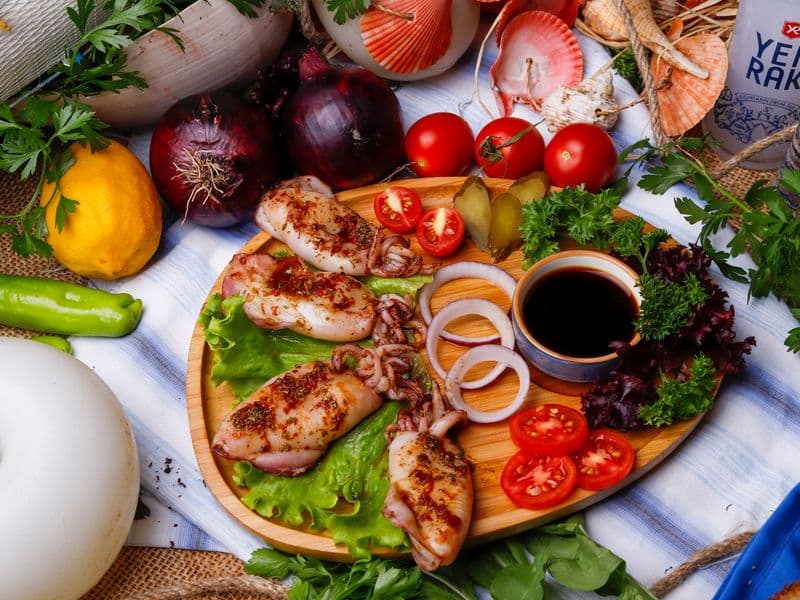
| 28 | Cuttlefish, cooked | Seafood | 32.5 |
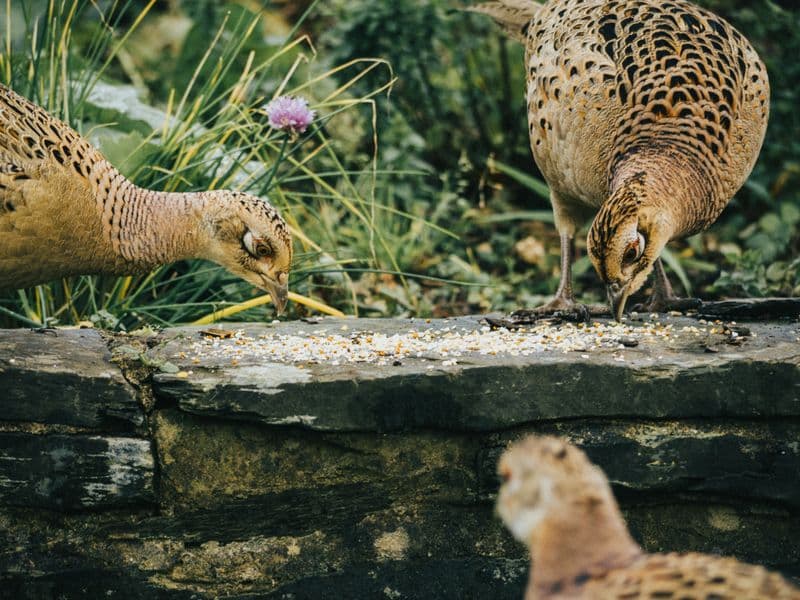
| 29 | Pheasant, cooked | Poultry | 32.4 |
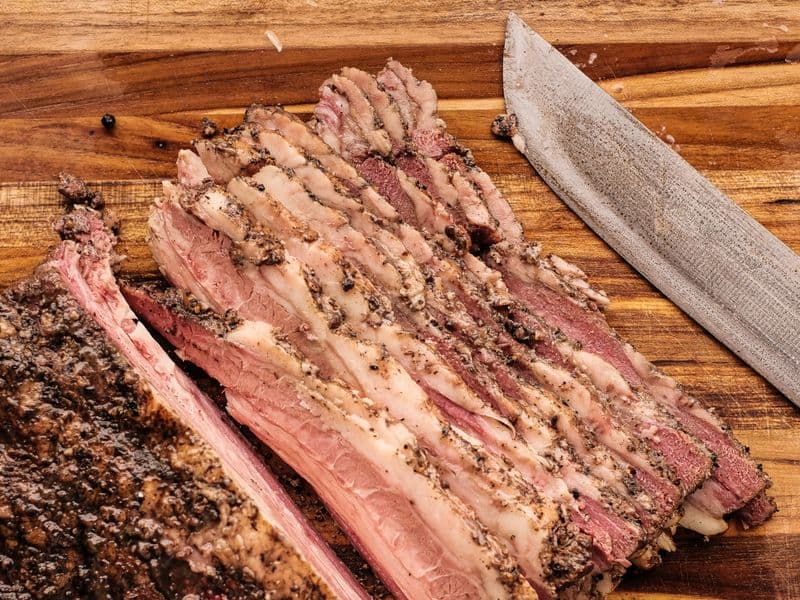
| 30 | Beef brisket, cooked | Red Meat | 32.2 |
| 31 | Beef Stick | Red Meat | 32.1 |
| 32 | Classic Beef Stick | Red Meat | 32.1 |
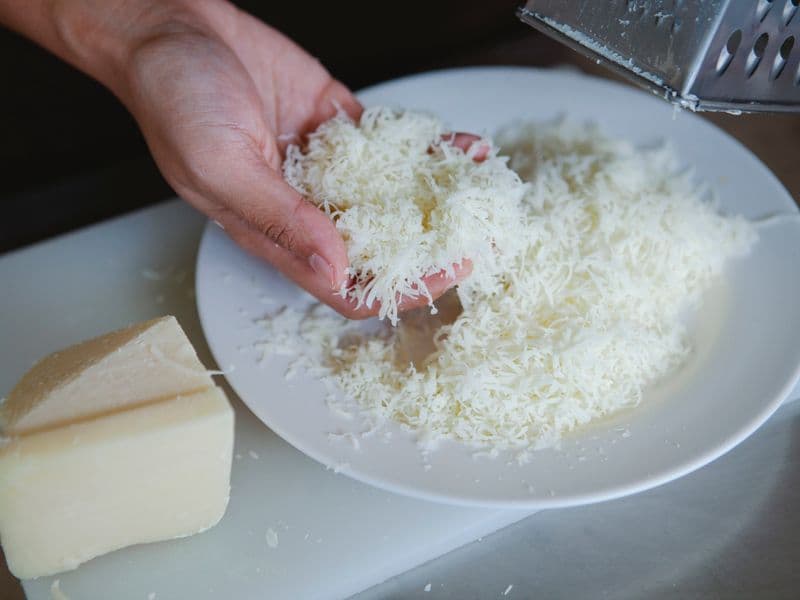
| 33 | Parmesan | Dairy | 32.1 |
| 34 | Parmigiano Reggiano Cheese | Dairy | 32.1 |
| 35 | Steak Strips Beef Snacks | Red Meat | 32.1 |
| 36 | Pecorino romano cheese | Dairy | 31.8 |
| 37 | Romano cheese | Dairy | 31.8 |
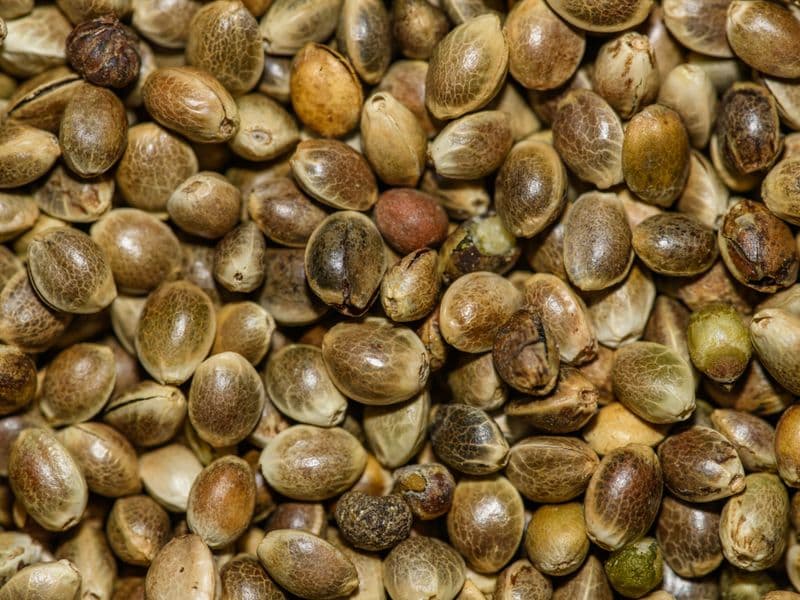
| 38 | Hemp seeds | Nuts & Seeds | 31.6 |
| 39 | Beef | Red Meat | 31.3 |
| 40 | Jalapeno Beef Stick | Red Meat | 31.3 |
| 41 | Original Beef Stick | Red Meat | 31.3 |
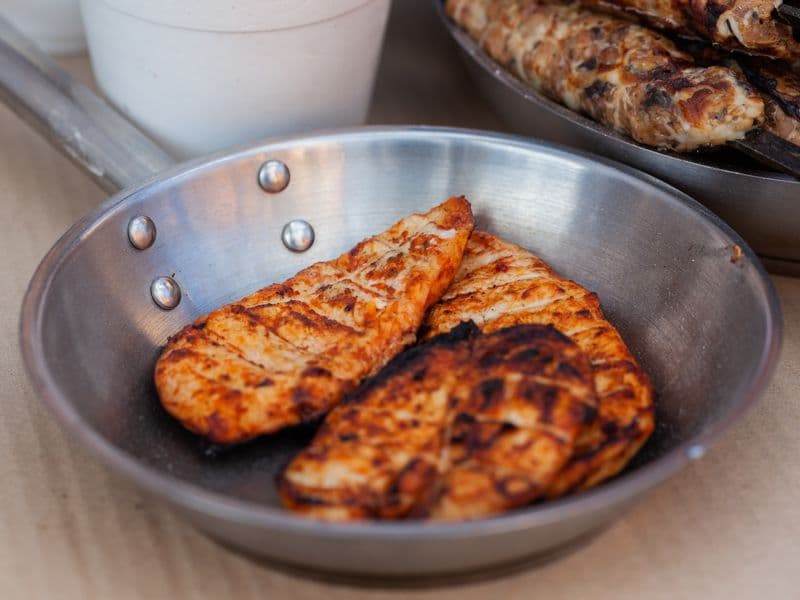
| 42 | Chicken breast, cooked | Poultry | 31 |
| 43 | Wild Ahi Yellowfin Tuna | Seafood | 30.6 |
| 44 | Ahi Yellowfin Tuna | Seafood | 30.6 |
| 45 | Lamb liver, cooked | Red Meat | 30.6 |
| 46 | Catalina Crunch Cinnamon Toast Protein Cereal | Grains | 30.6 |
| 47 | Cinnamon Toast Protein Cereal | Grains | 30.6 |
| 48 | Goat cheese, hard | Dairy | 30.5 |
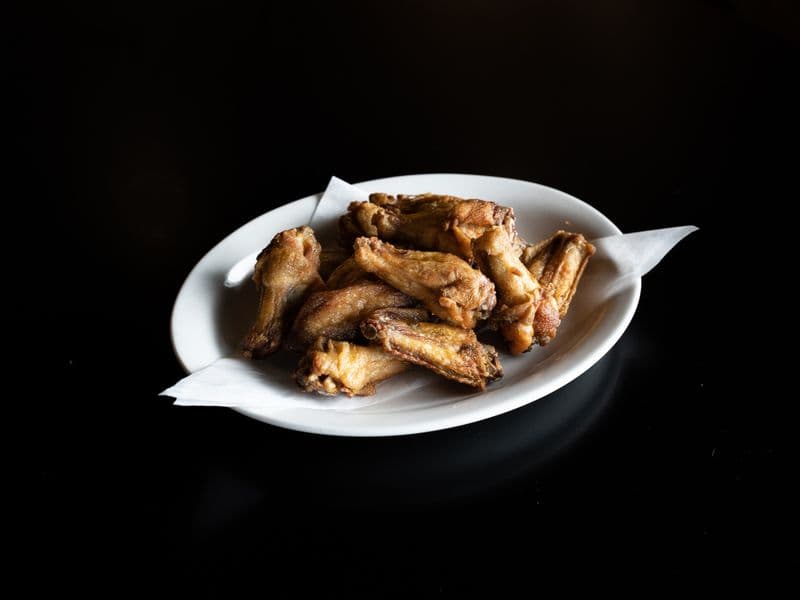
| 49 | Chicken wing, cooked | Poultry | 30.5 |
| 50 | Chicken gizzards, cooked | Poultry | 30.4 |

How this is calculatedformula · basis · source
Formula: protein grams per 100 g
Basis: Per 100 g edible portion.
Source: USDA FoodData Central. Foods missing this value are not ranked (missing ≠ zero).