
Highest protein per 100 calories
Foods ranked by protein density — grams of protein per 100 kcal.
2036 ranked foods
| # | Food | Category | g / 100 kcal |
|---|---|---|---|
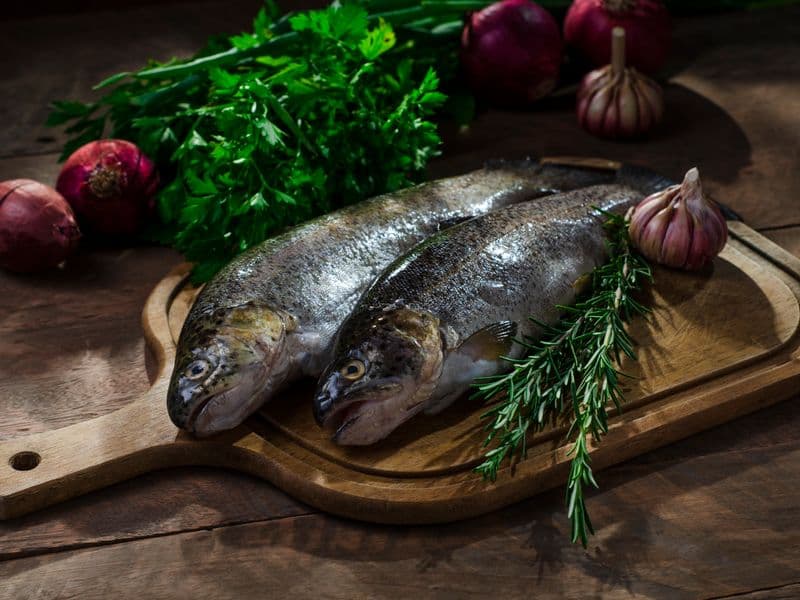
| 226 | Trout, cooked | Seafood | 14.2 |
| 227 | Plain Yogurt | Dairy | 14.2 |
| 228 | Total 2% Milkfat | Dairy | 14.2 |
| 229 | Sockeye salmon, canned | Seafood | 14.1 |
| 230 | Carp, cooked | Seafood | 14.1 |
| 231 | Low-fat cheddar cheese | Dairy | 14.1 |
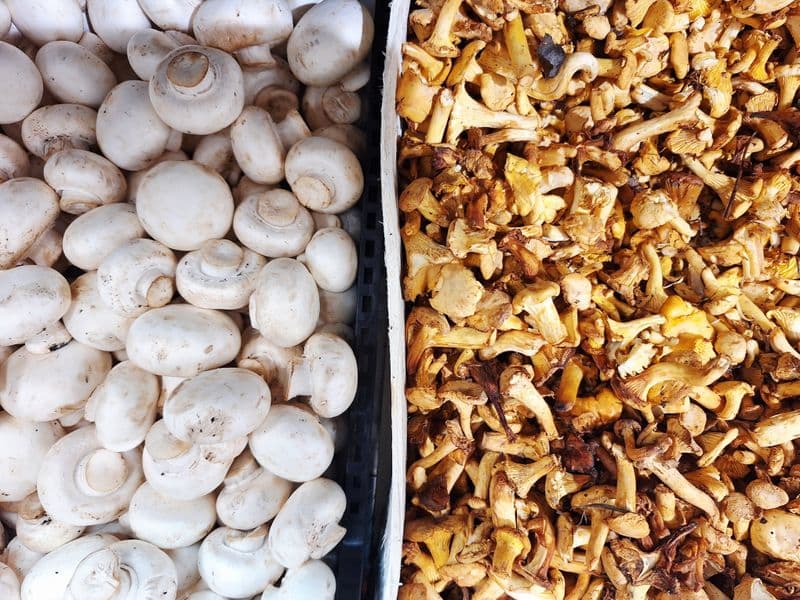
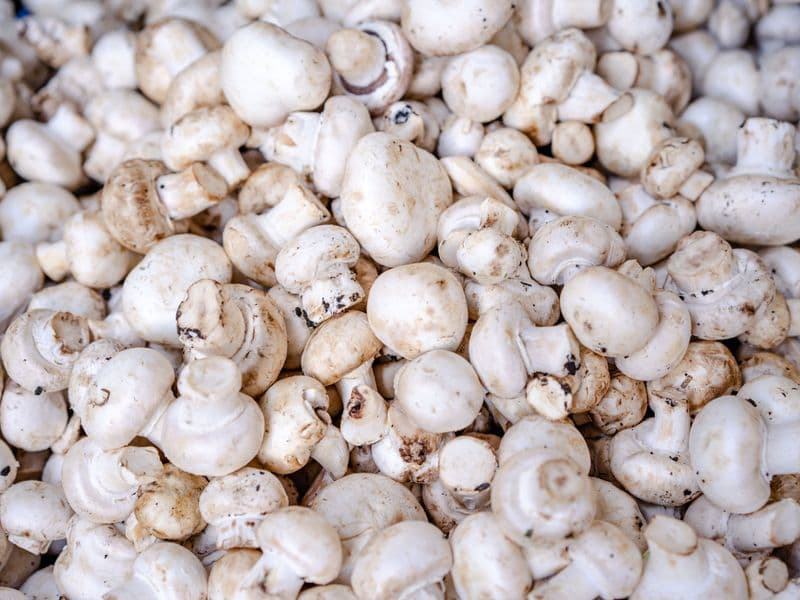
| 232 | Mushrooms, raw | Vegetables | 14 |
| 233 | White mushrooms, raw | Vegetables | 14 |
| 234 | Ground beef, 93% lean, cooked | Red Meat | 14 |
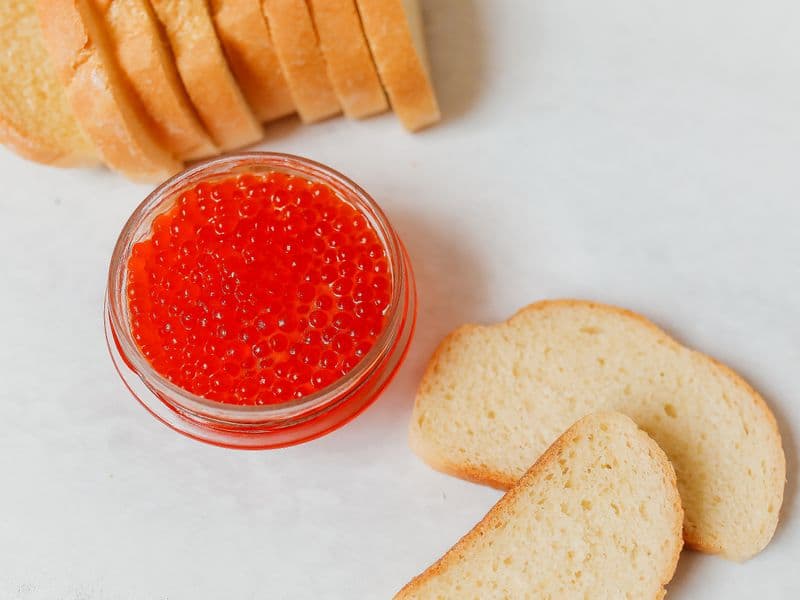
| 235 | Fish roe, cooked | Seafood | 14 |
| 236 | Cottage Cheese | Dairy | 14 |
| 237 | 4% Milkfat Classic Cottage Cheese | Dairy | 14 |
| 238 | Bamboo shoots, cooked | Vegetables | 13.9 |
| 239 | Lamb liver, cooked | Red Meat | 13.9 |
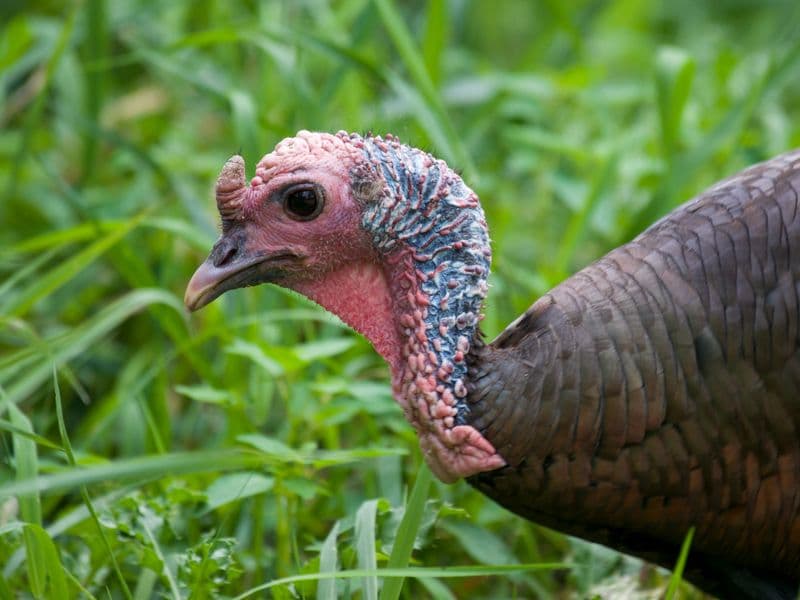
| 240 | Turkey neck, cooked | Poultry | 13.9 |
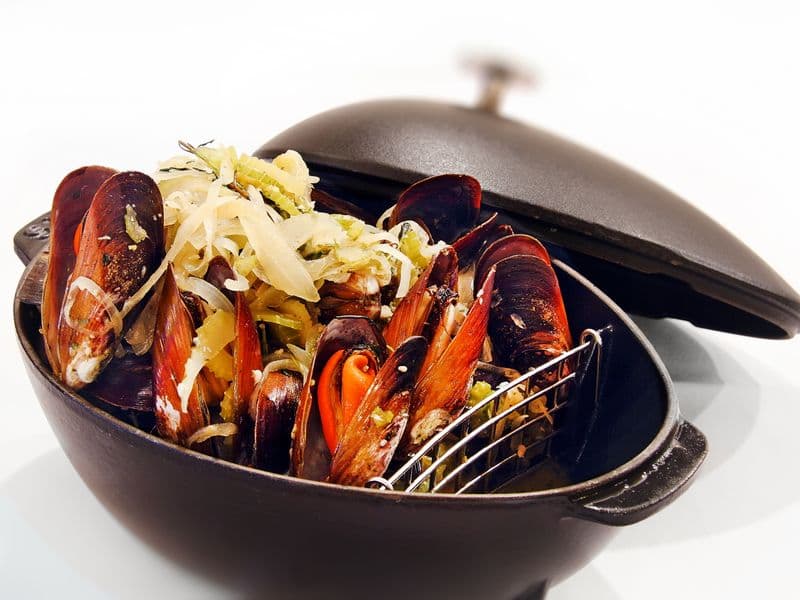
| 241 | Mussels, cooked | Seafood | 13.8 |
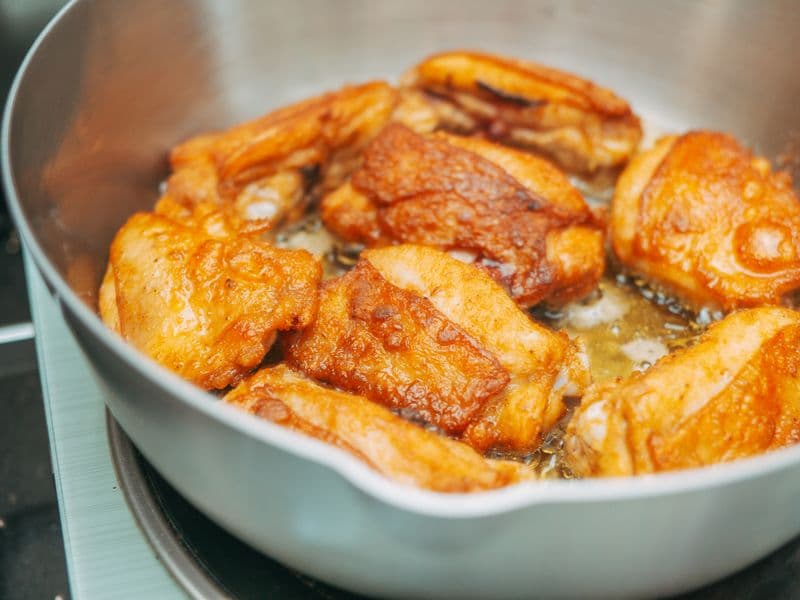
| 242 | Chicken thigh, cooked | Poultry | 13.8 |
| 243 | Yellowfin Tuna In Olive Oil | Seafood | 13.8 |
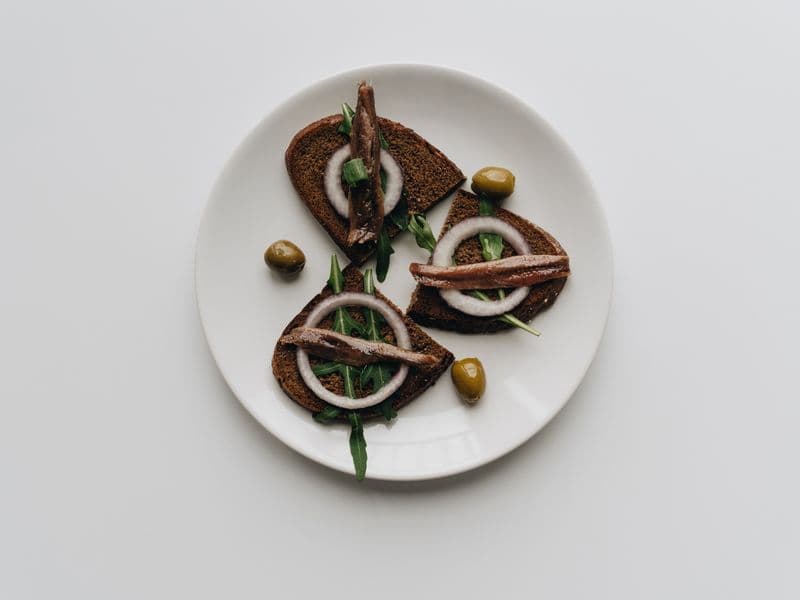
| 244 | Anchovies, canned | Seafood | 13.8 |
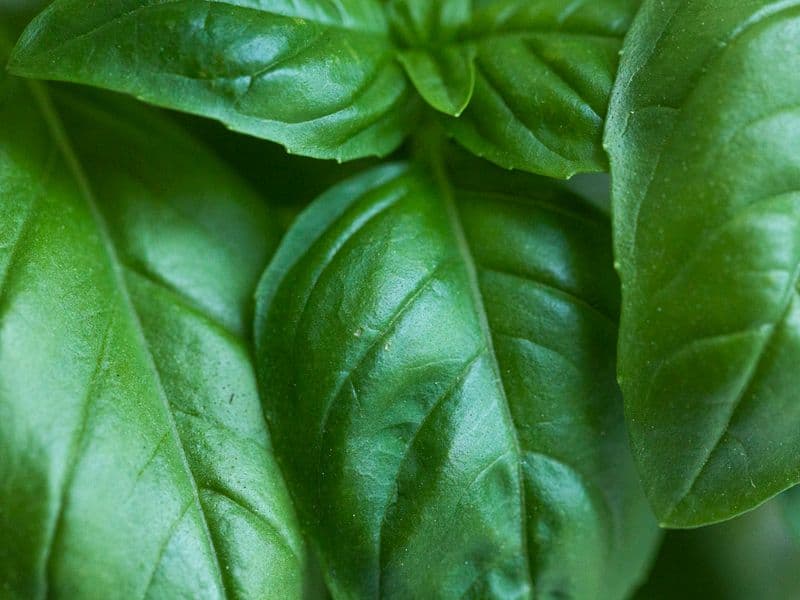
| 245 | Basil, fresh | Herbs & Spices | 13.7 |
| 246 | 6 Sausage Rashers | Red Meat | 13.6 |
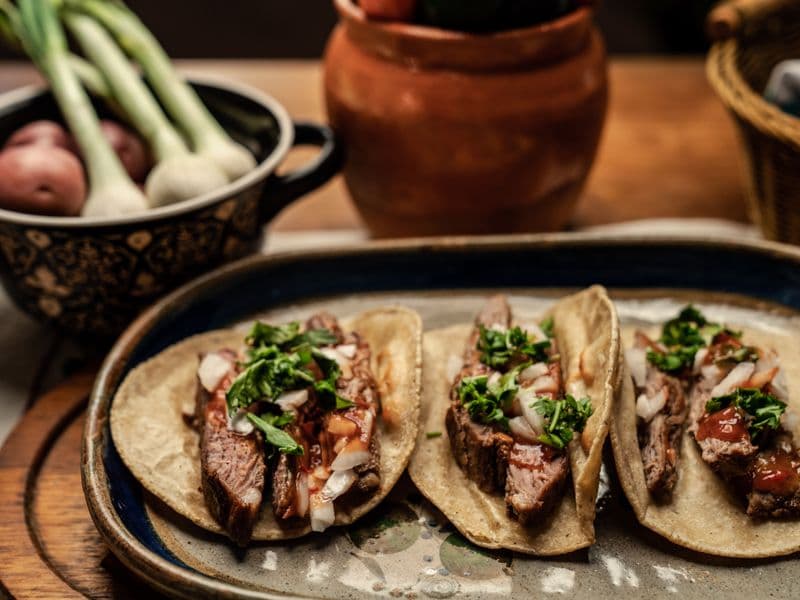
| 247 | Beef flank steak, cooked | Red Meat | 13.6 |
| 248 | Swordfish, cooked | Seafood | 13.6 |
| 249 | Pheasant, cooked | Poultry | 13.6 |
| 250 | Ground turkey, cooked | Poultry | 13.5 |


How this is calculatedformula · basis · source
Formula: protein_per_100g ÷ energy_kcal_per_100g × 100
Basis: Protein grams per 100 kcal (energy density basis).
Source: USDA FoodData Central. Foods missing this value are not ranked (missing ≠ zero).