
Highest protein per 100 calories
Foods ranked by protein density — grams of protein per 100 kcal.
2036 ranked foods
| # | Food | Category | g / 100 kcal |
|---|---|---|---|
| 26 | Haddock, cooked | Seafood | 22.2 |
| 27 | Albacore Solid White Tuna | Seafood | 22.1 |
| 28 | Solid White Tuna Albacore In Water | Seafood | 22 |
| 29 | Chunk Light Tuna In Water | Seafood | 22 |
| 30 | Oven Roasted Turkey Breast | Red Meat | 22 |
| 31 | Roasted Turkey Breast | Red Meat | 22 |
| 32 | Canned tuna in water, drained | Seafood | 22 |
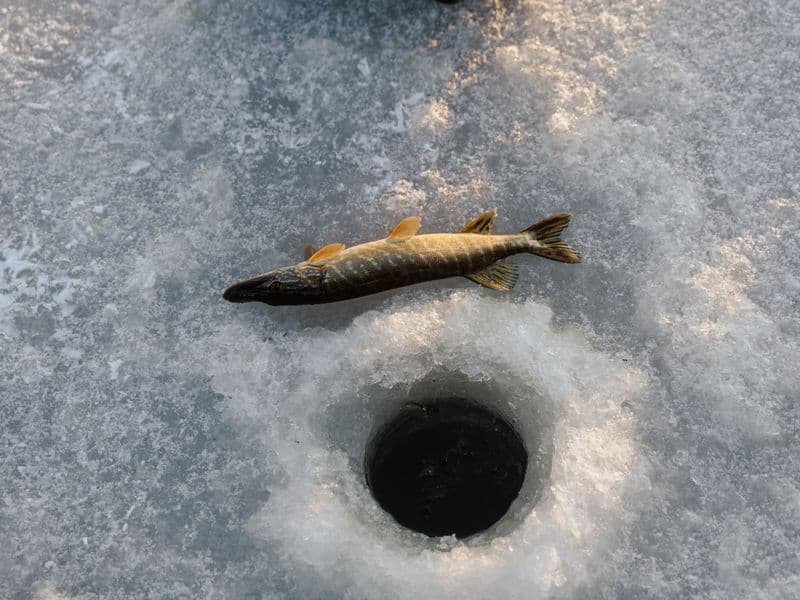
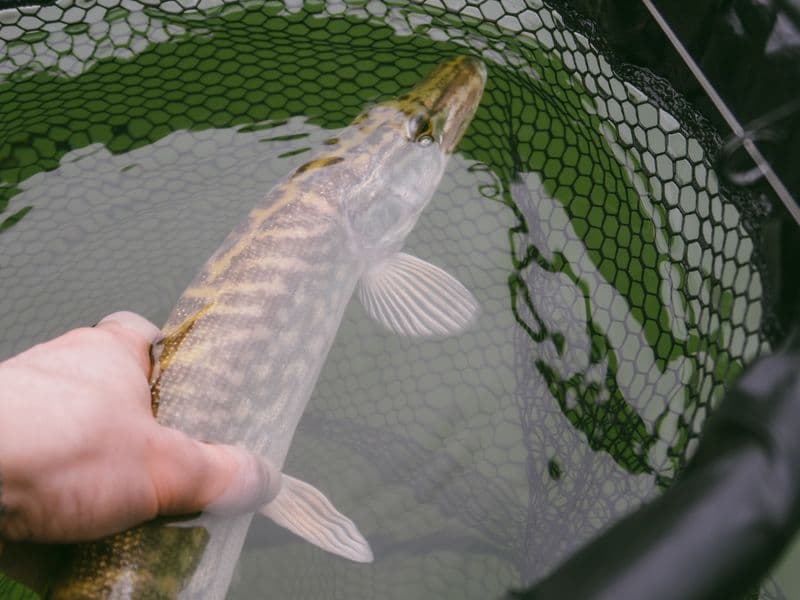
| 33 | Northern pike, cooked | Seafood | 21.8 |
| 34 | Pike, cooked | Seafood | 21.8 |
| 35 | Moose, cooked | Red Meat | 21.8 |
| 36 | Vanilla | Dairy | 21.8 |
| 37 | Roast Chicken Slices | Red Meat | 21.8 |
| 38 | Mahi-mahi, cooked | Seafood | 21.8 |
| 39 | Smoked haddock | Seafood | 21.8 |
| 40 | Cod, cooked | Seafood | 21.7 |
| 41 | Cusk, cooked | Seafood | 21.7 |
| 42 | Albacore White Tuna In Water Pouch | Seafood | 21.6 |
| 43 | Chargrilled British Chicken Breast Slices | Red Meat | 21.6 |
| 44 | Orange roughy, cooked | Seafood | 21.6 |
| 45 | Blue crab, canned | Seafood | 21.5 |
| 46 | Crab, cooked | Seafood | 21.5 |
| 47 | Burbot, cooked | Seafood | 21.5 |
| 48 | Skipjack tuna, cooked | Seafood | 21.4 |
| 49 | Lobster, cooked | Seafood | 21.3 |
| 50 | Roast Chicken | Red Meat | 21.3 |






How this is calculatedformula · basis · source
Formula: protein_per_100g ÷ energy_kcal_per_100g × 100
Basis: Protein grams per 100 kcal (energy density basis).
Source: USDA FoodData Central. Foods missing this value are not ranked (missing ≠ zero).