
Highest protein per 100 calories
Foods ranked by protein density — grams of protein per 100 kcal.
1267 ranked foods
| # | Food | Category | g / 100 kcal |
|---|---|---|---|
| 101 | Chicken giblets, cooked | Poultry | 16.1 |
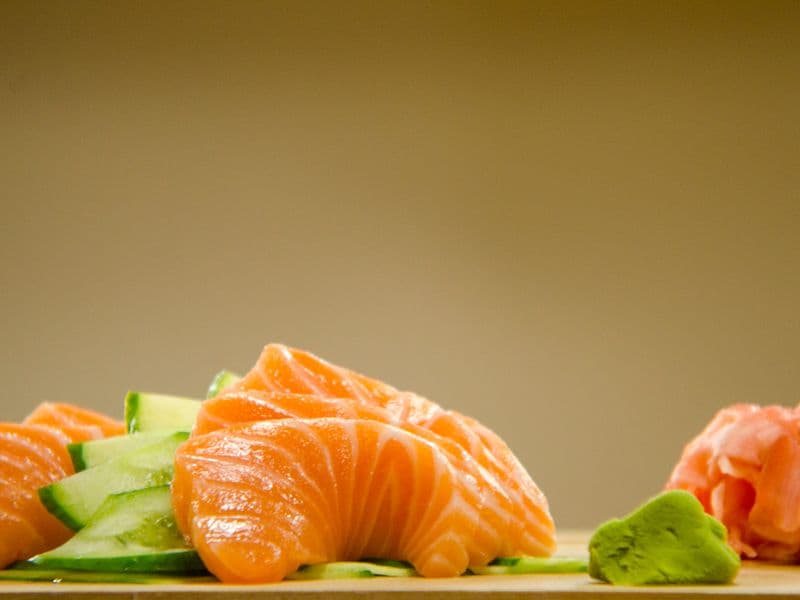
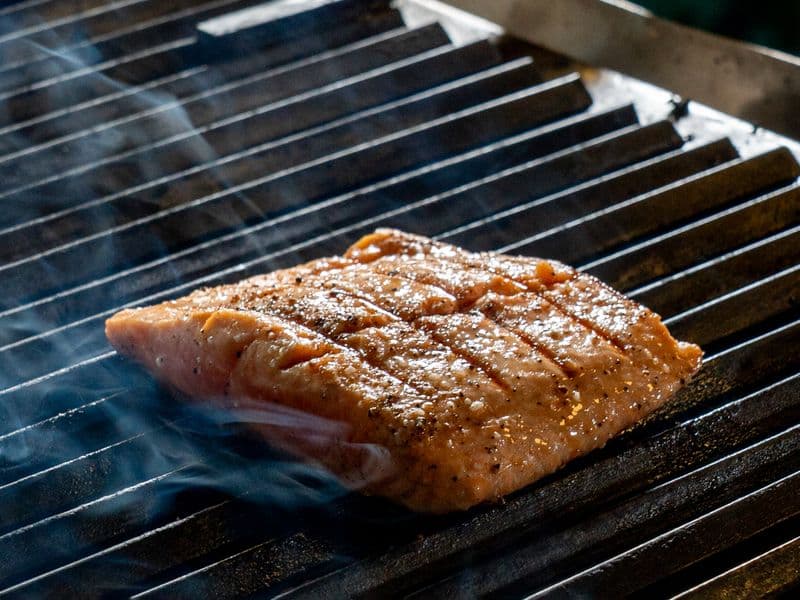
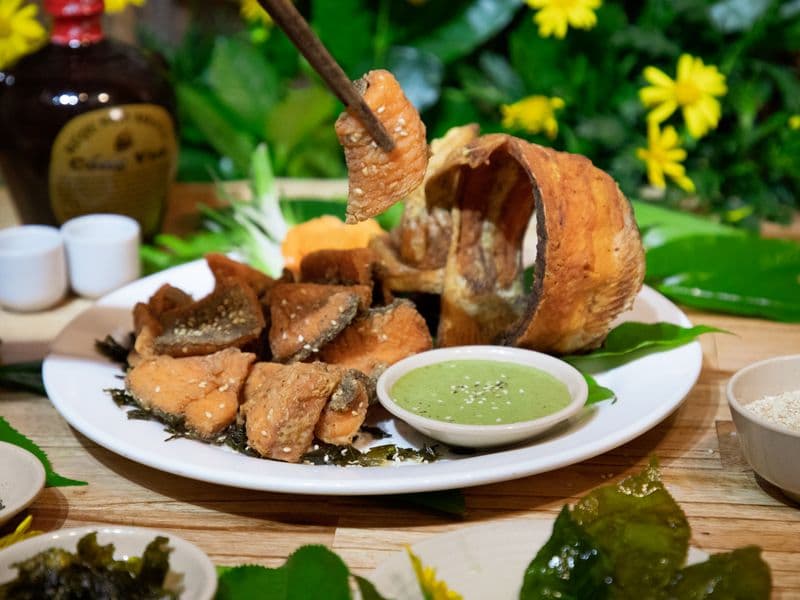
| 102 | Pink salmon, cooked | Seafood | 16.1 |
| 103 | Peanut flour, defatted | Legumes & Soy | 16 |
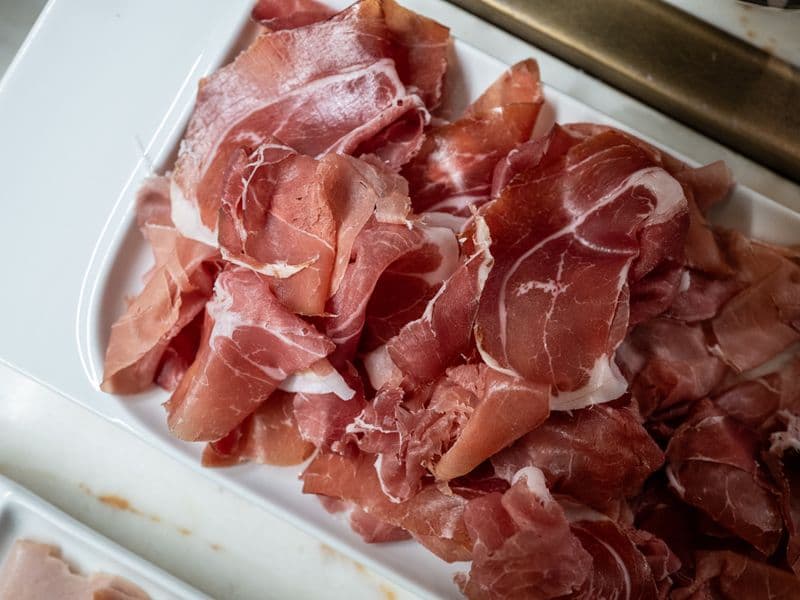
| 104 | Ham, roasted | Red Meat | 16 |
| 105 | Turkey thigh, cooked | Poultry | 15.8 |
| 106 | Ground beef, 95% lean, cooked | Red Meat | 15.7 |
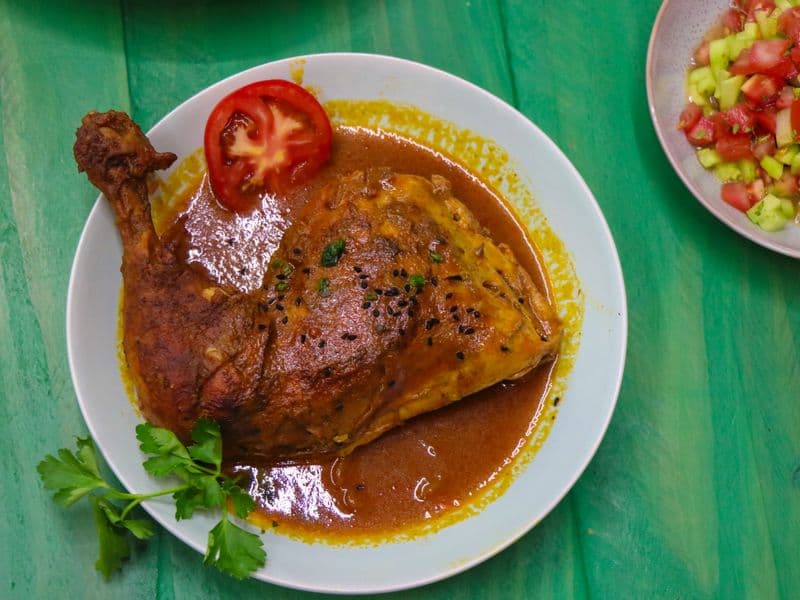
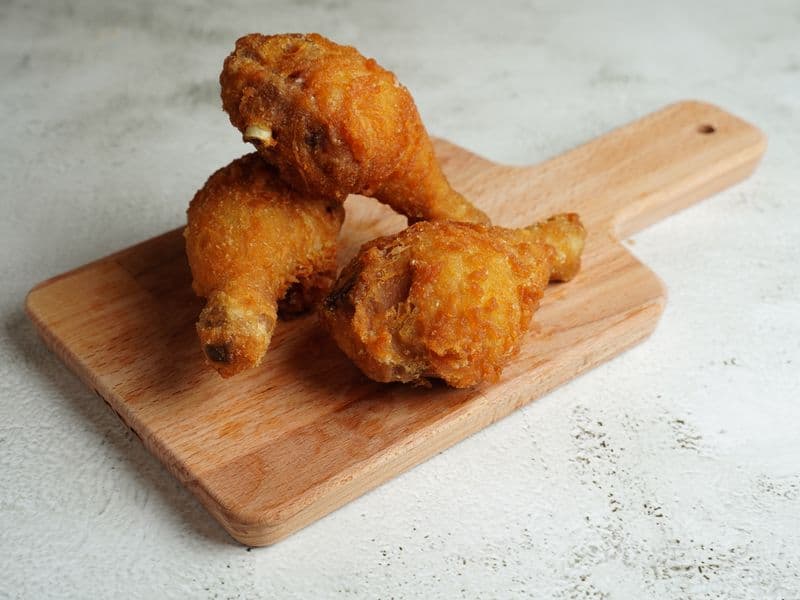
| 107 | Chicken drumstick, cooked | Poultry | 15.6 |
| 108 | Smoked salmon (lox) | Seafood | 15.6 |
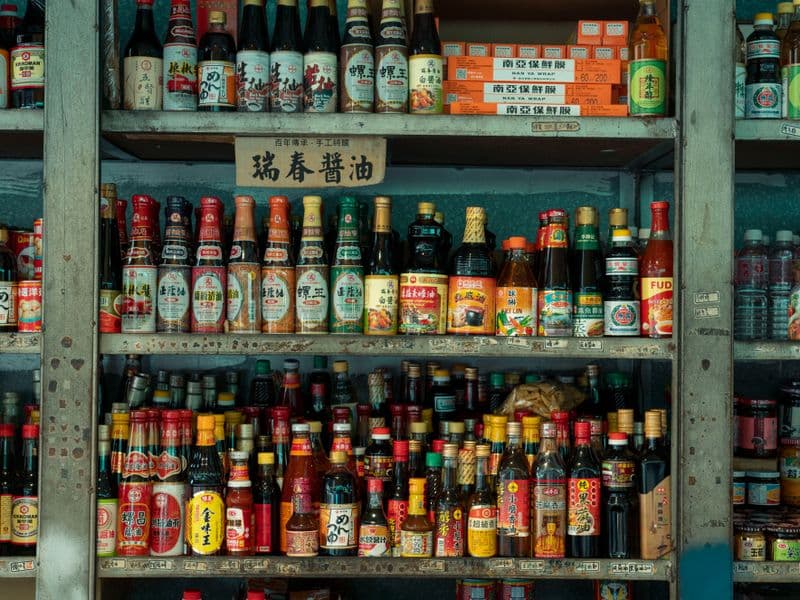
| 109 | Soy sauce (shoyu) | Legumes & Soy | 15.4 |
| 110 | Sturgeon, cooked | Seafood | 15.3 |
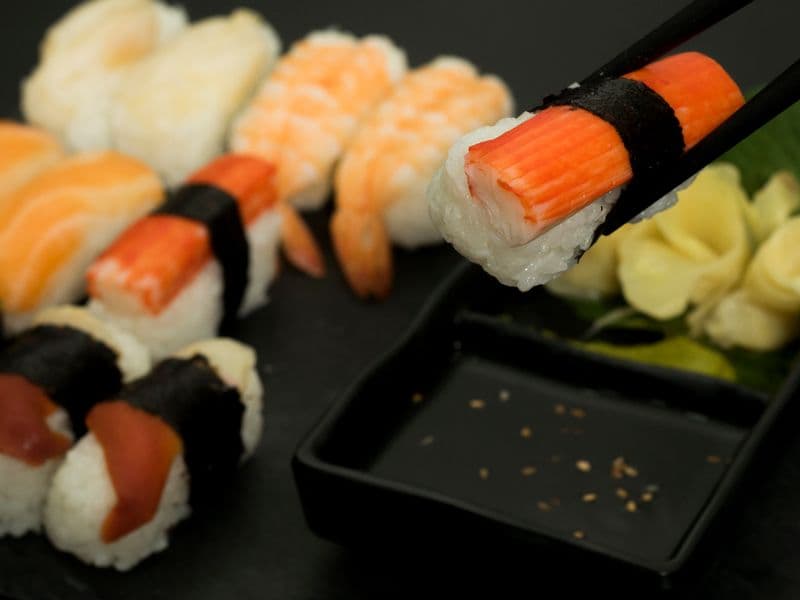
| 111 | Surimi (imitation crab) | Seafood | 15.3 |
| 112 | Broccoli rabe, cooked | Vegetables | 15.3 |
| 113 | Turkey giblets, cooked | Poultry | 15.3 |
| 114 | Beef liver, cooked | Red Meat | 15.2 |
| 115 | Chicken breast with skin, roasted | Poultry | 15.1 |
| 116 | Beef liver, raw | Red Meat | 15.1 |
| 117 | Spot, cooked | Seafood | 15 |
| 118 | Cottonseed flour, partially defatted | Nuts & Seeds | 15 |
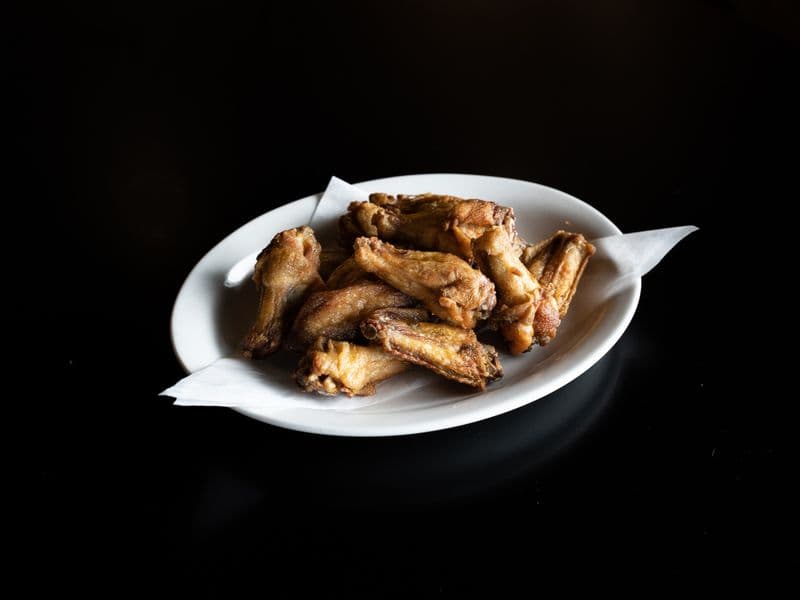
| 119 | Chicken wing, cooked | Poultry | 15 |
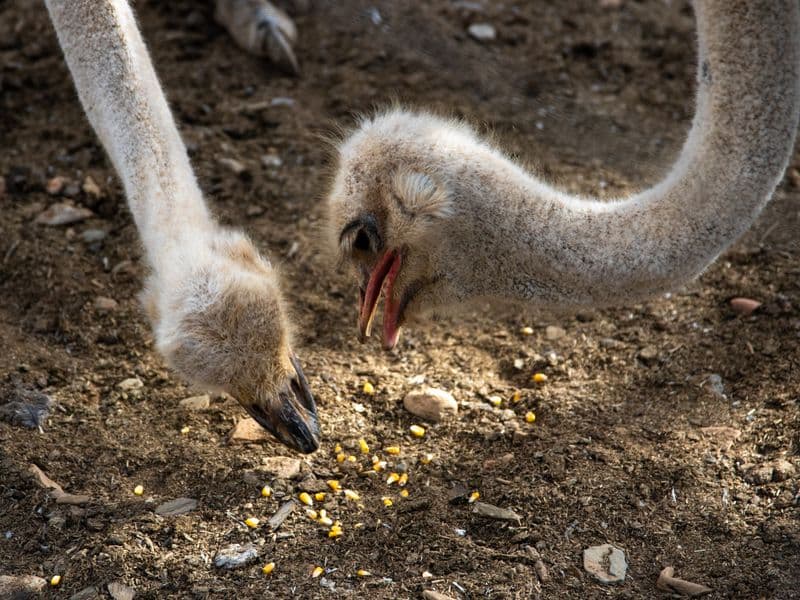
| 120 | Ostrich, cooked | Poultry | 14.9 |
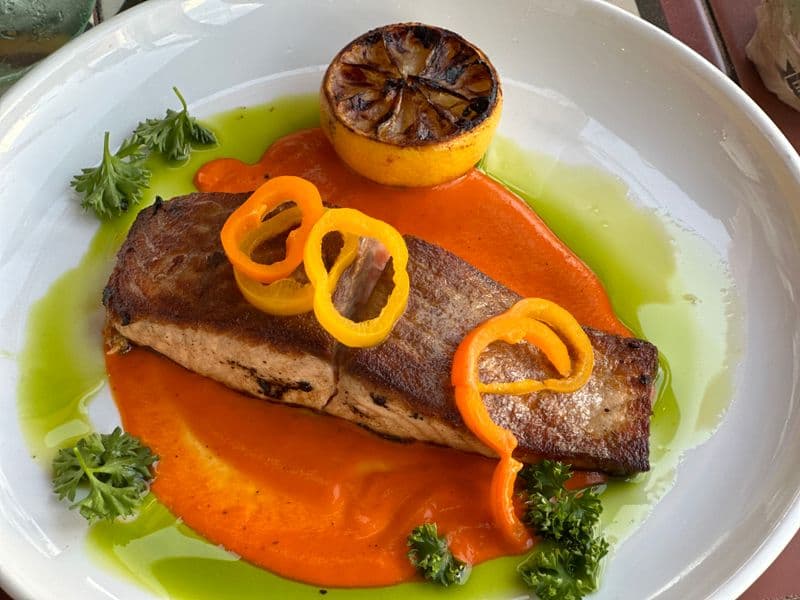
| 121 | Coho salmon, cooked | Seafood | 14.9 |
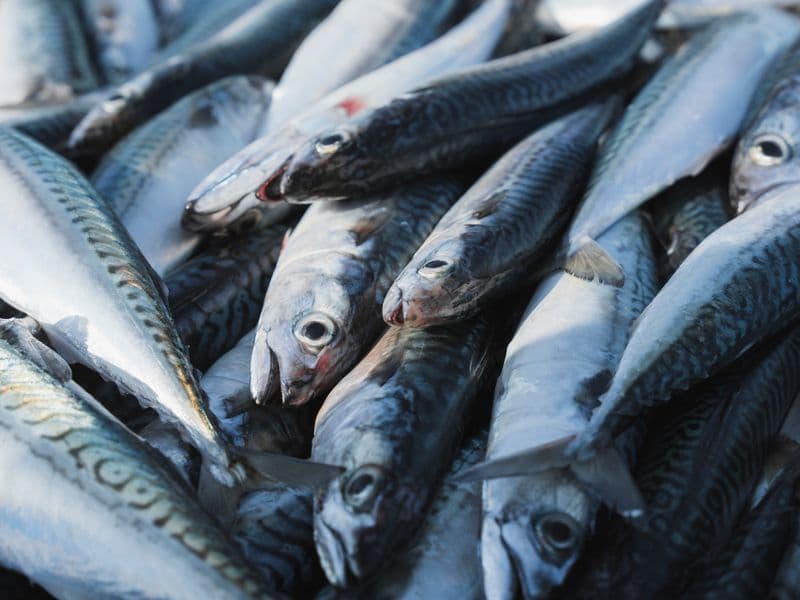
| 122 | Mackerel, canned | Seafood | 14.9 |
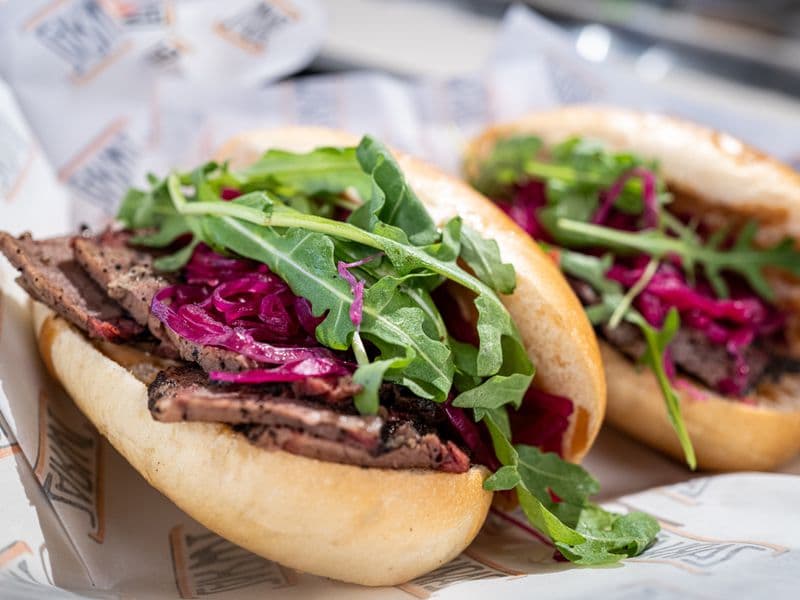
| 123 | Beef pastrami | Red Meat | 14.8 |
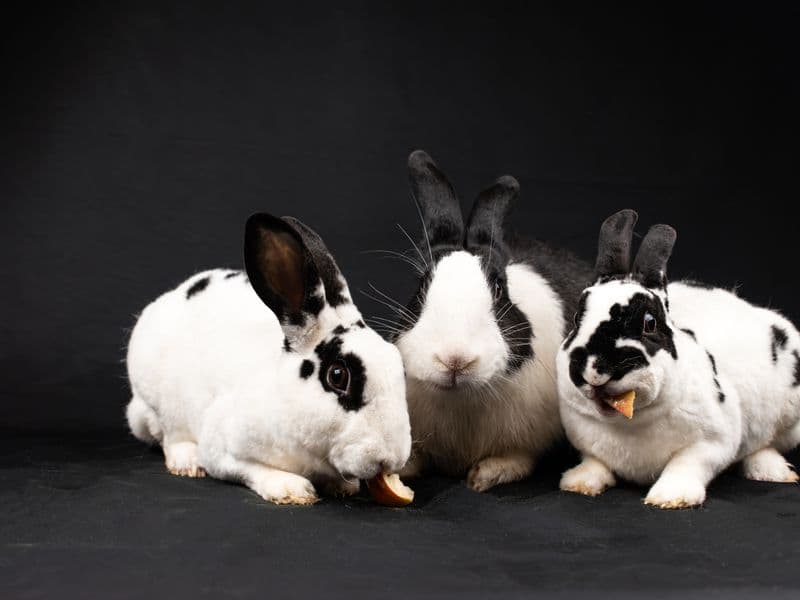
| 124 | Rabbit, cooked | Red Meat | 14.8 |
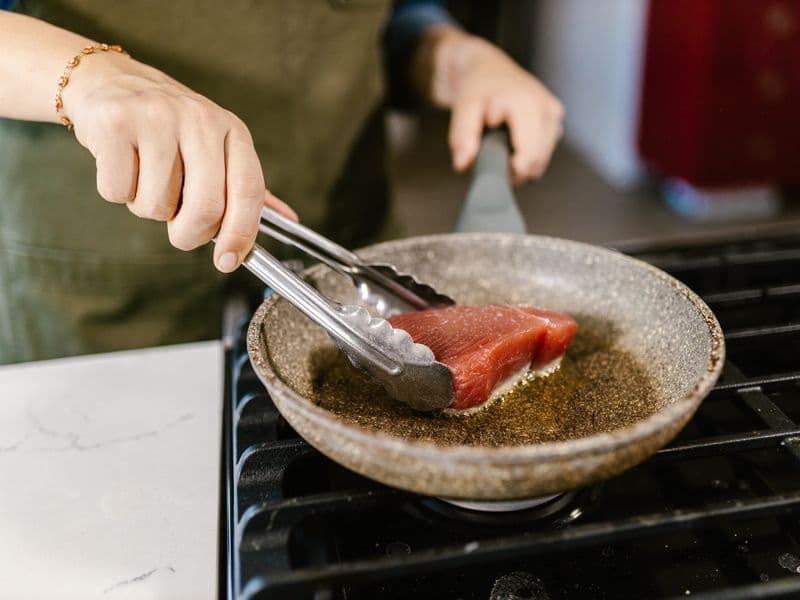
| 125 | Canned tuna in oil | Seafood | 14.7 |

How this is calculatedformula · basis · source
Formula: protein_per_100g ÷ energy_kcal_per_100g × 100
Basis: Protein grams per 100 kcal (energy density basis).
Source: USDA FoodData Central. Foods missing this value are not ranked (missing ≠ zero).