
Highest-protein foods
Foods ranked by protein content per 100 g.
1271 ranked foods
| # | Food | Category | g |
|---|---|---|---|
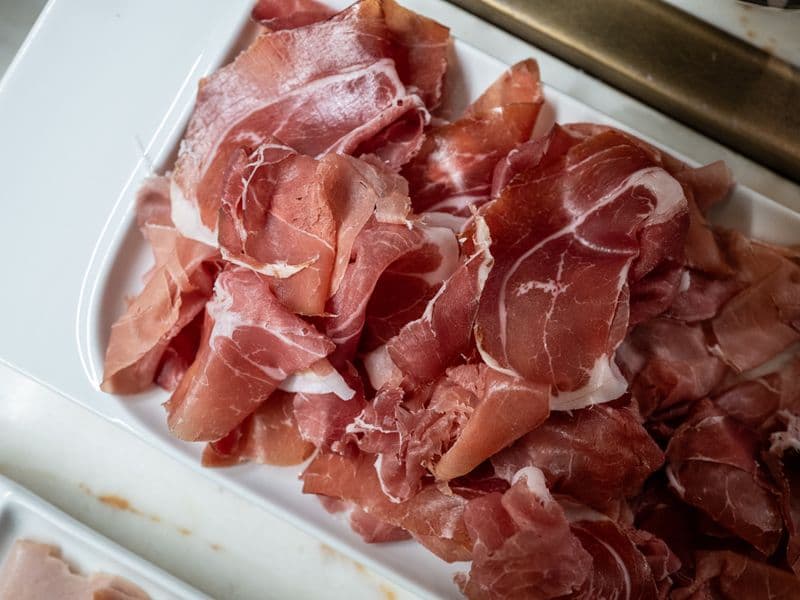
| 126 | Ham, roasted | Red Meat | 25.1 |
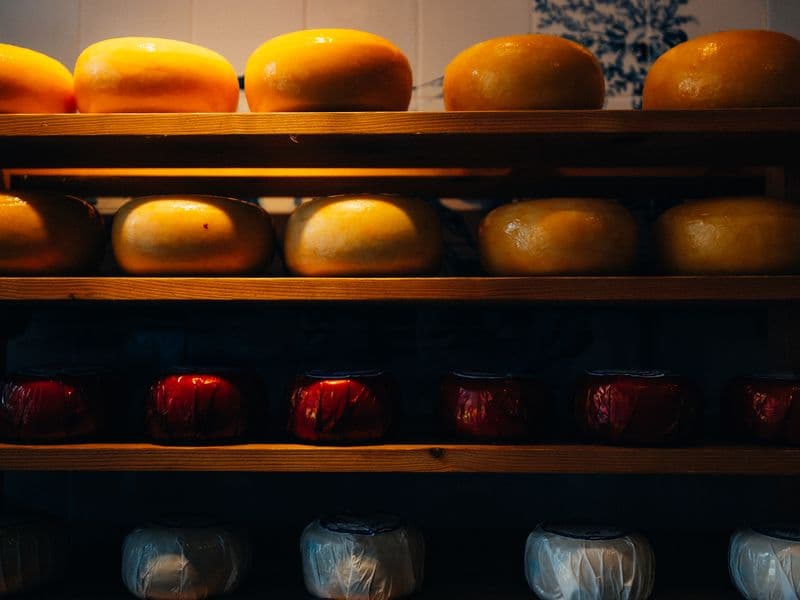
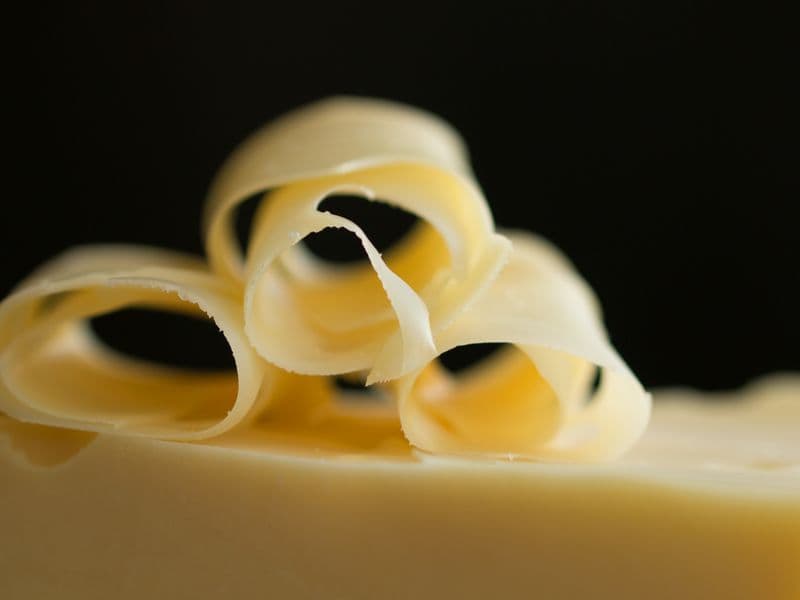
| 127 | Edam cheese | Dairy | 25 |
| 128 | Gouda cheese | Dairy | 24.9 |
| 129 | Pollock, cooked | Seafood | 24.9 |
| 130 | Butternuts, dried | Nuts & Seeds | 24.9 |
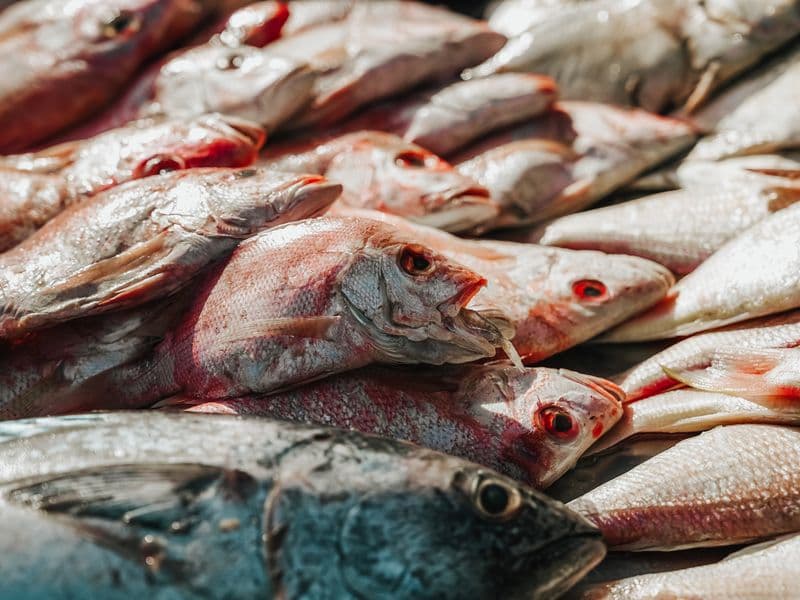
| 131 | Perch, cooked | Seafood | 24.9 |
| 132 | Grouper, cooked | Seafood | 24.8 |
| 133 | Lamb leg, cooked | Red Meat | 24.8 |
| 134 | Mullet, cooked | Seafood | 24.8 |
| 135 | Veal loin, cooked | Red Meat | 24.8 |
| 136 | Burbot, cooked | Seafood | 24.8 |
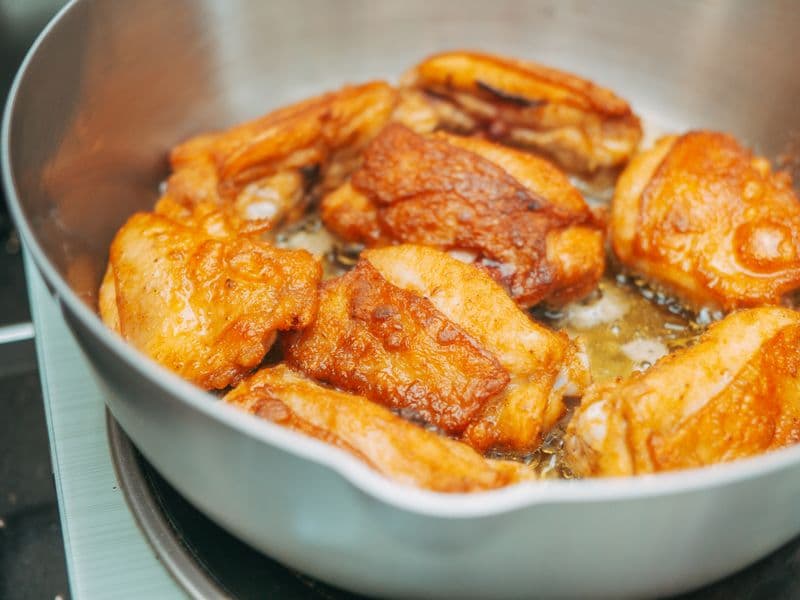
| 137 | Chicken thigh, cooked | Poultry | 24.8 |
| 138 | Ground lamb, cooked | Red Meat | 24.8 |
| 139 | Processed Swiss cheese | Dairy | 24.7 |
| 140 | Northern pike, cooked | Seafood | 24.7 |
| 141 | Pike, cooked | Seafood | 24.7 |
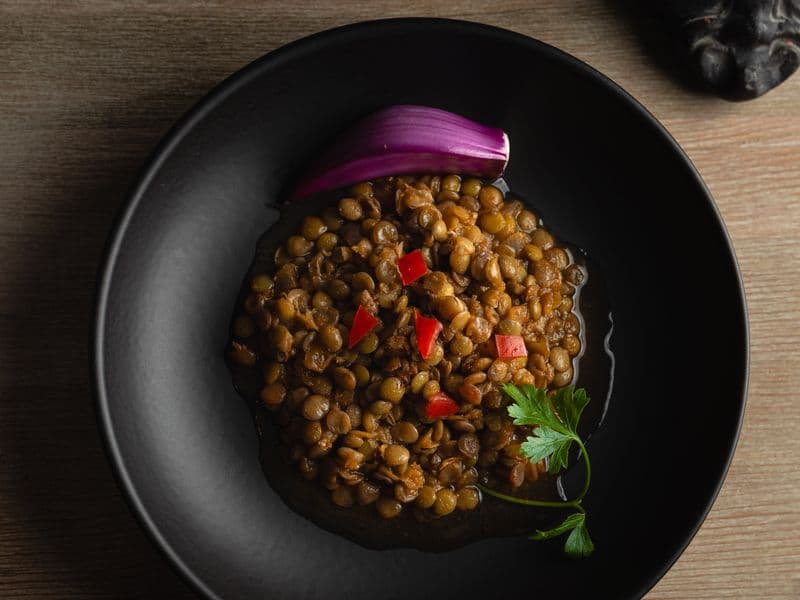
| 142 | Lentils, raw | Legumes & Soy | 24.6 |
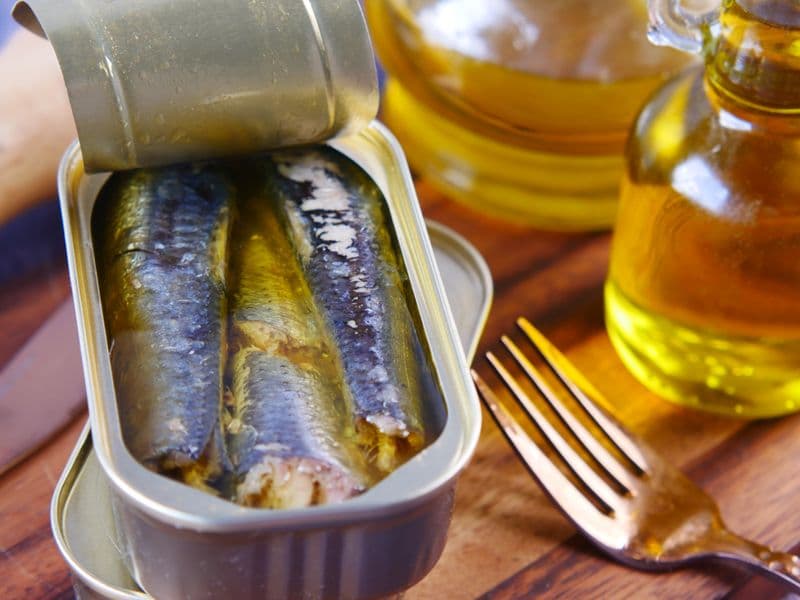
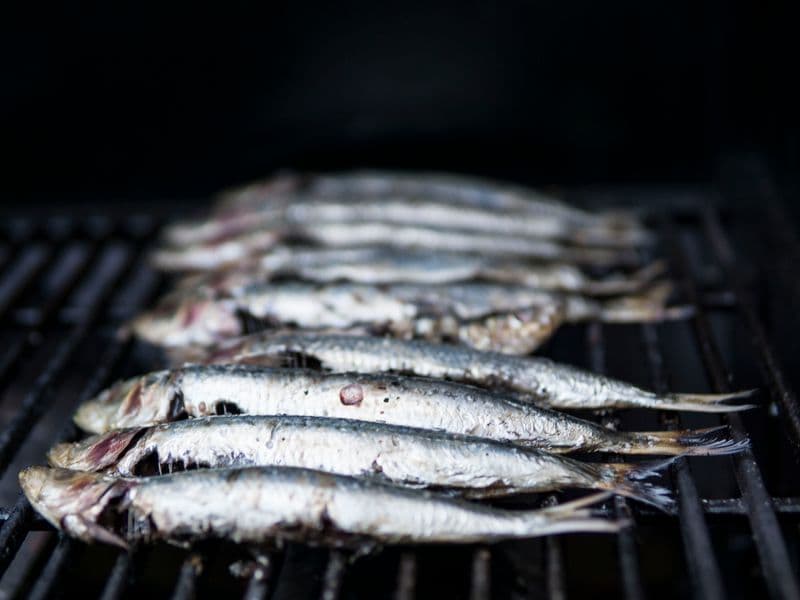
| 143 | Canned sardines in oil | Seafood | 24.6 |
| 144 | Ground beef, 85% lean, cooked | Red Meat | 24.6 |
| 145 | Sardines, canned | Seafood | 24.6 |
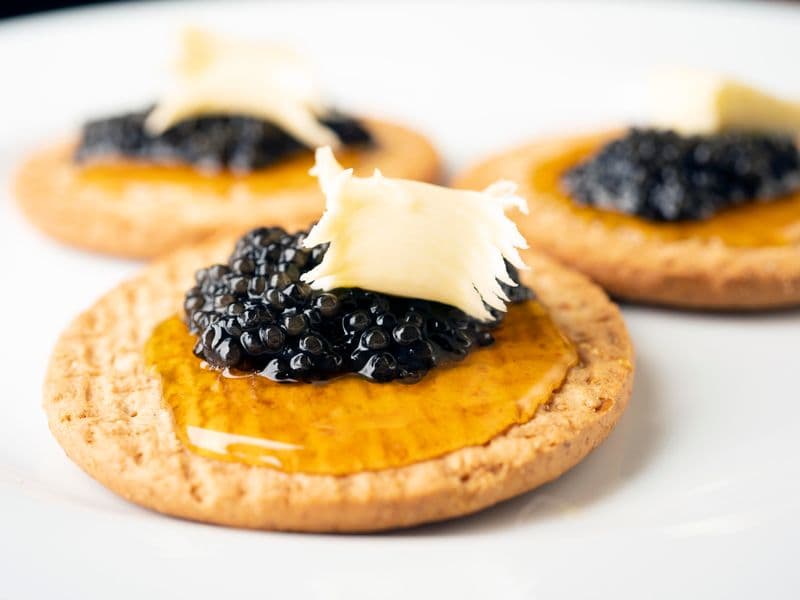
| 146 | Caviar (fish roe) | Seafood | 24.6 |
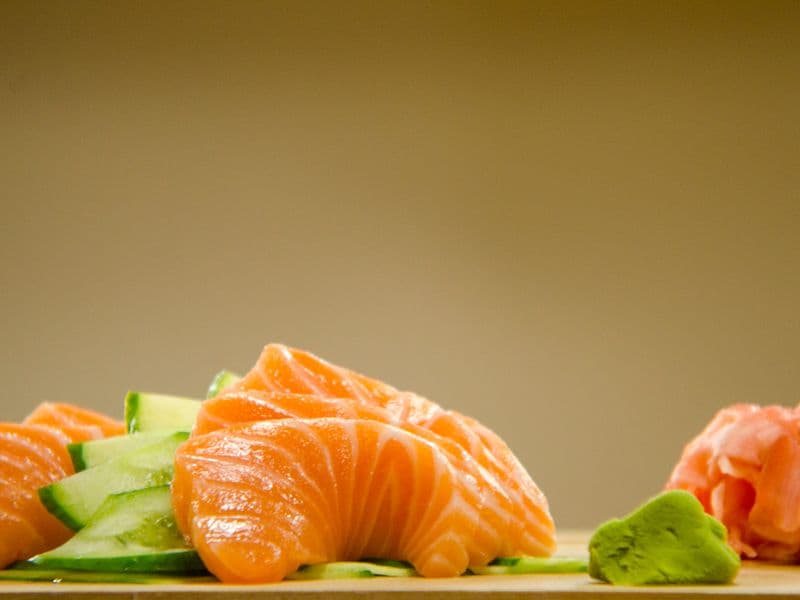
| 147 | Pink salmon, cooked | Seafood | 24.6 |
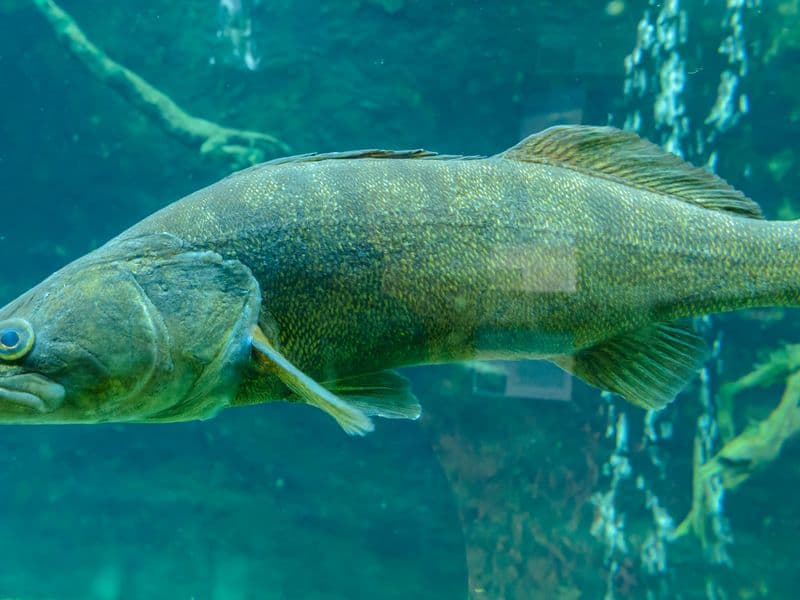
| 148 | Walleye, cooked | Seafood | 24.5 |
| 149 | Tilefish, cooked | Seafood | 24.5 |
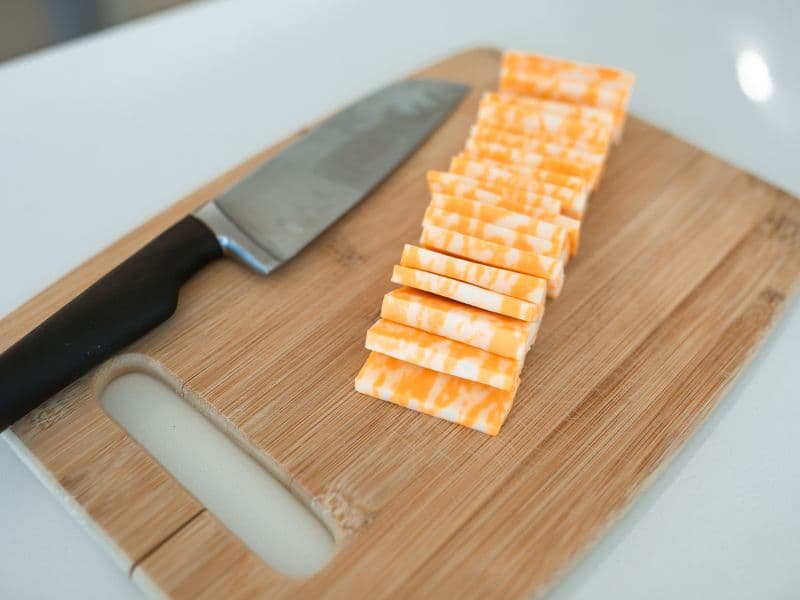
| 150 | Monterey Jack cheese | Dairy | 24.5 |










How this is calculatedformula · basis · source
Formula: protein grams per 100 g
Basis: Per 100 g edible portion.
Source: USDA FoodData Central. Foods missing this value are not ranked (missing ≠ zero).